Search for Articles
What Analytics CropLink Provides?
Gain deep insights into your link performance with our comprehensive analytics dashboard. Track clicks, visitor behavior, and traffic sources in real-time to optimize your marketing campaigns and understand your audience better.
Key Metrics & Data Points
We provide detailed analytics for every shortened link, including:
- Geolocation – See where your clicks are coming from (country, city).
- Device Type – Breakdown of desktop, mobile, and tablet usage.
- Operating System (OS) – Identify whether users are on Windows, macOS, iOS, Android, etc.
- Browser – Track which browsers (Chrome, Safari, Firefox, Edge, etc.) drive the most traffic.
- Language – Understand the preferred languages of your audience.
- Referrer – Discover where your traffic originates (direct, social media, search engines, emails, etc.).
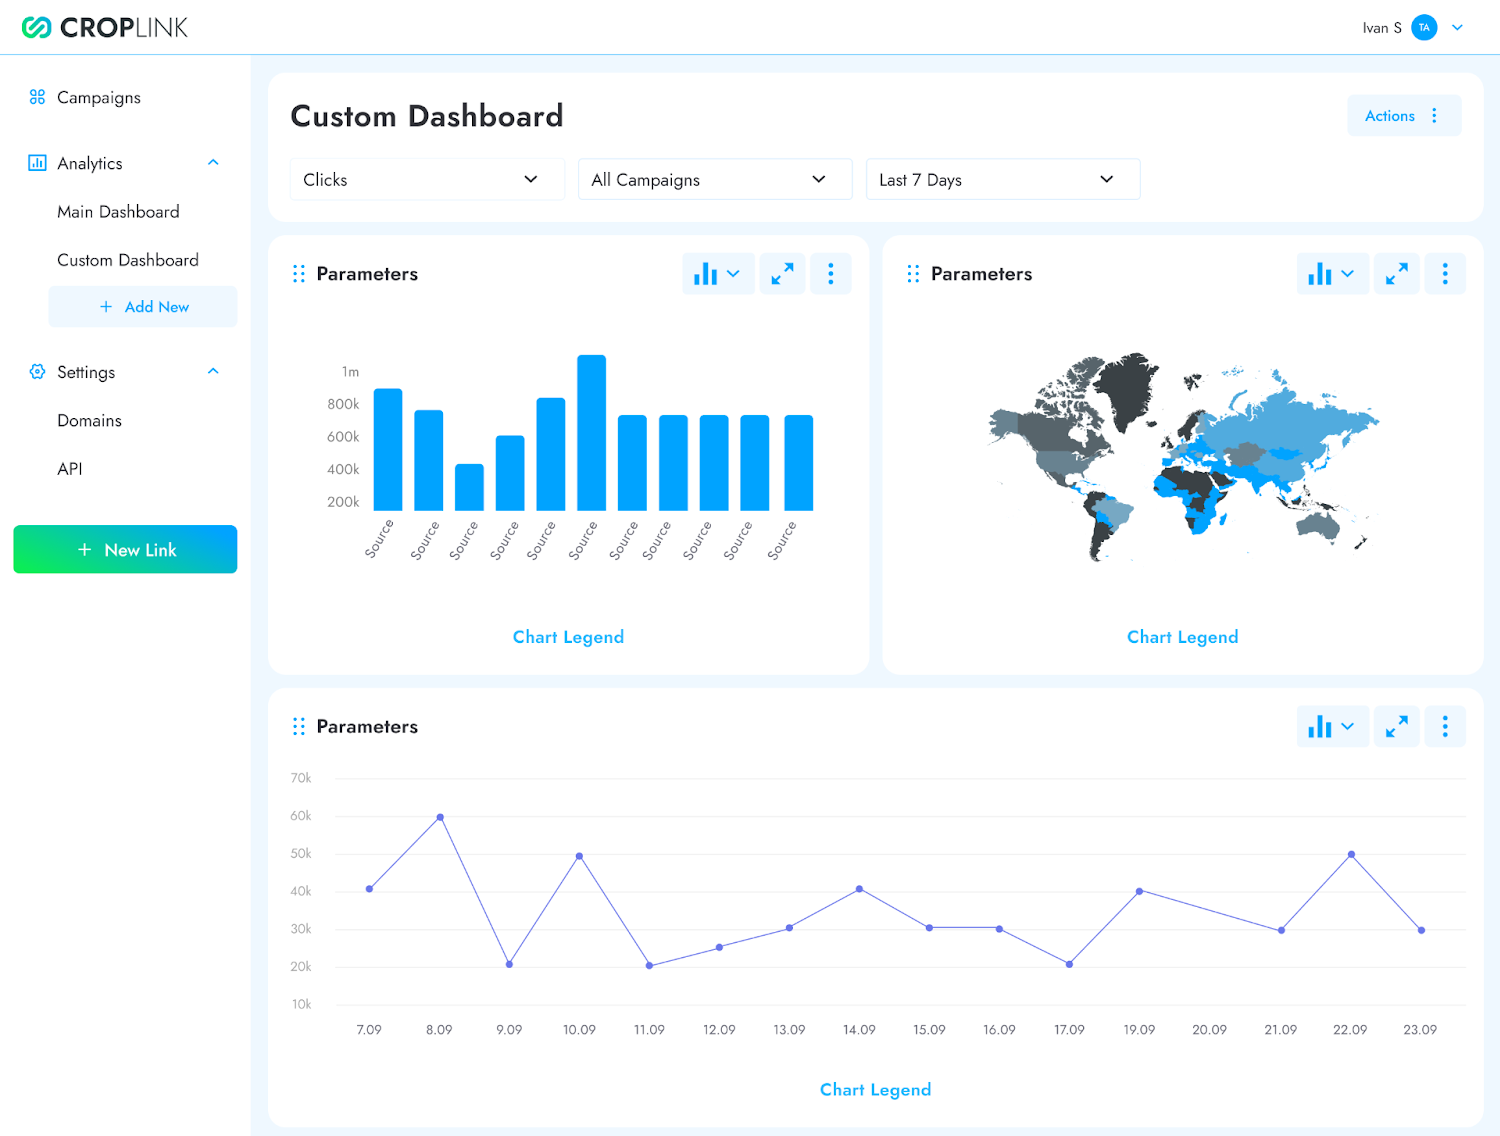
Interactive Charts & Visualization
Our analytics dashboard features multiple chart types to help you interpret data effectively:
1. Line Chart
Purpose: Visualize trends over time.
Use Cases:
- Track total clicks and unique clicks per day/week/month.
- Monitor traffic spikes and drops to correlate with campaigns.
2. Column Chart
Purpose: Compare data across categories and time.
Use Cases:
- Analyze clicks by country, device, or browser.
- Compare performance between different time periods (e.g., before and after a campaign).
3. Pie Chart
Purpose: Display proportional distribution of clicks.
Use Cases:
- See the percentage of traffic from different devices (mobile vs. desktop).
- Breakdown of top languages, OS usage, or browser shares.
4. Cartogram
Purpose: Geographic visualization of clicks.
Features:
- A color-coded world map highlights click density by country.
- The scale ranges from 0 to 1000+ clicks, with darker shades indicating higher traffic.
- Zoom in to see regional insights (city-level data where available).
How to Use Analytics for Better Performance
- Optimize Campaigns: Identify high-performing regions and platforms to allocate resources effectively.
- Audience Insights: Adjust content based on device and browser preferences.
- Referral Tracking: Measure which sources (social media, email, ads) drive the most engagement.
With these powerful analytics tools, you can refine your strategies, boost engagement, and maximize the impact of every link you share.
Have another question?
Contact us